Safety signals and pharmacovigilance
Signal, Cohort, Trial: Tiers of Drug-Safety Evidence
A spontaneous report, an observational cohort and a randomised trial each answer a different question about harm, and each fails in a characteristic way. This is the harm-measurement counterpart to the site's efficacy framework.
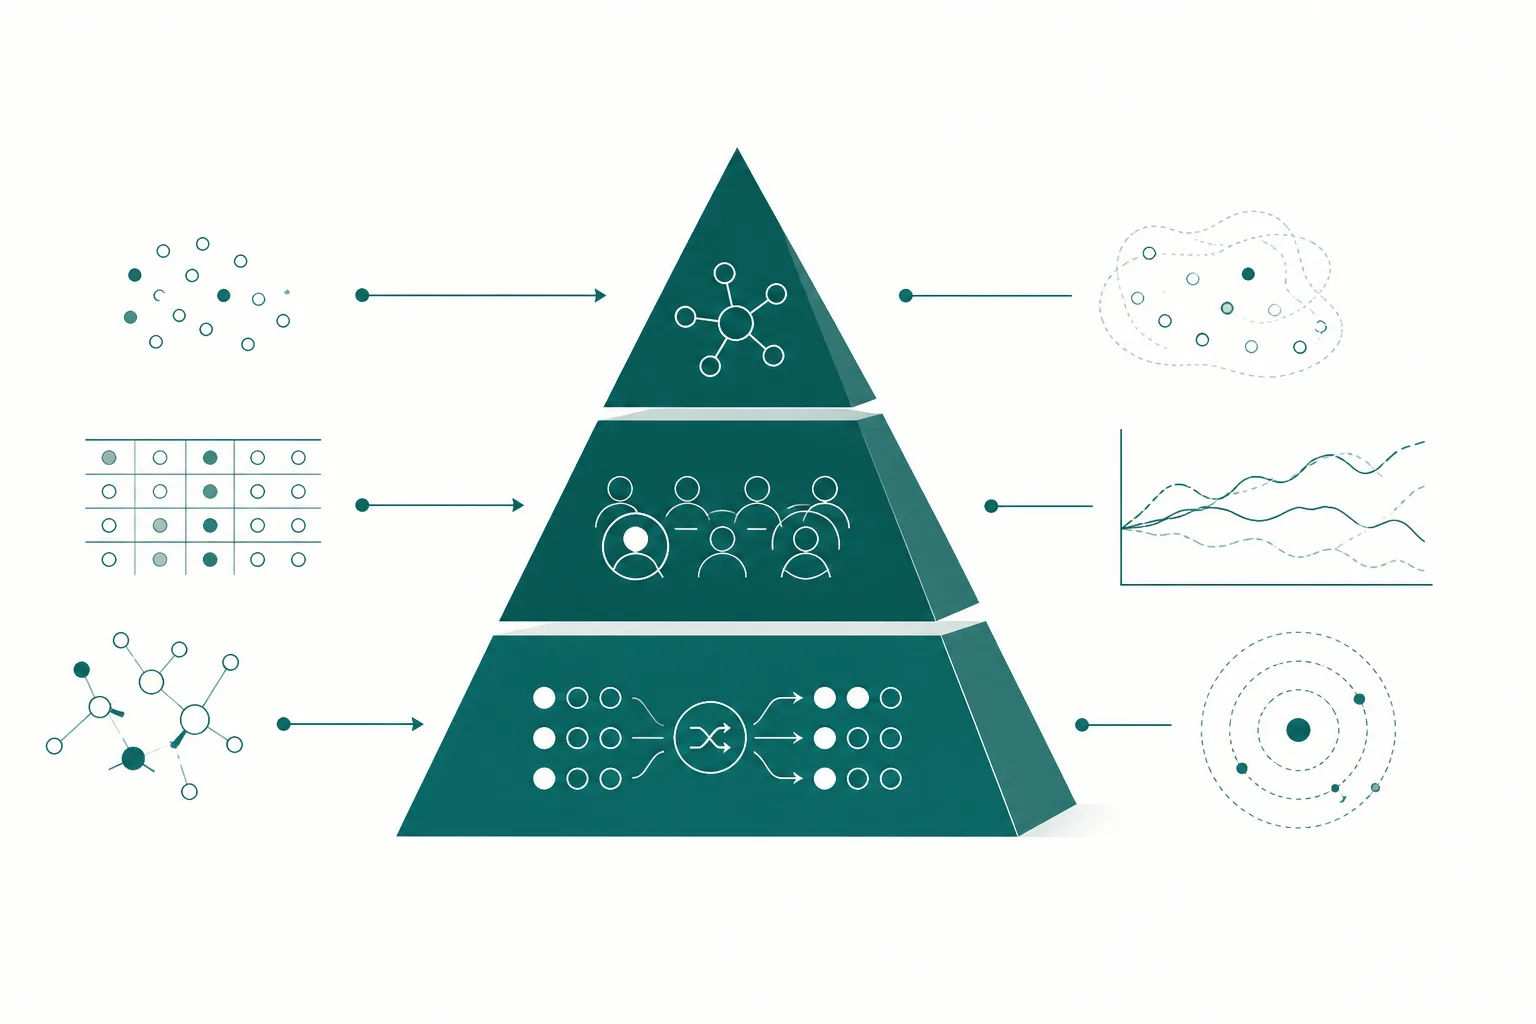
A spontaneous report can establish that something was noticed and is worth checking; an observational cohort can estimate how much more often an event occurs in treated than in comparable untreated people; a randomised trial can establish causation for events common enough to be counted. Each fails where the others succeed. A report has no denominator, a cohort has no randomisation, and a trial usually has too few events 15.
This article sets out the three tiers as a method, so that compound-specific pieces on this site can cite it rather than repeat it. It is the harm-measurement counterpart to the framework used for efficacy, where concentration-response curves and maximal effect are the language. Here the language is signals, rates and hazard ratios. Evidence tiers are named in every section, because the commonest error in this literature is to treat a result from one tier as if it came from another.
What a spontaneous report is, and the denominator it does not have
A spontaneous report is a voluntary notification of a suspected adverse reaction, sent by a clinician, patient or manufacturer to a regulator or monitoring centre. It records an exposure, an event and a time. It does not record how many people were exposed and did not have the event, or how many had the event without exposure. Without those, no incidence can be calculated. The report is an observation about one person in one setting.
That does not make reports weak evidence for their purpose. Their strength is breadth and speed: they cover whole populations in routine use, including people excluded from trials, and can surface an event before any study is designed to look for it. The European guidance defines a signal as information from one or more sources suggesting a new, potentially causal association or a new aspect of a known one, judged to be of enough likelihood to warrant verification 2. A signal is a prompt for work, not a conclusion. Evidence tier: pharmacovigilance.
Disproportionality measures: what they compute and what they cannot
Because absolute rates are unavailable, analysts compare within the database. Four common measures are the proportional reporting ratio, the reporting odds ratio, the information component and the empirical Bayes geometric mean; the last two apply Bayesian shrinkage to damp noisy estimates from small counts 3. In each, the question is whether a given event makes up a larger share of the reports for one drug than of reports for all other drugs. A drug with 12 reports of an event, against an expected 3, stands out.
What the number cannot say matters as much. The US regulator's data-mining page states that results are considered hypothesis generating and do not by themselves demonstrate causal associations, and that absence of disproportionality does not confirm the absence of a signal 1. It lists limitations including spurious alerts from concomitant exposures, dictionary constraints, confounding by indication and the limits of passive reporting systems 1.
Known biases: notoriety, masking and stimulated reporting
Three biases recur. Notoriety bias is the rise in reports of an event after publicity, regardless of whether true incidence changed. Masking is the suppression of a real signal for one drug by a large volume of reports for another drug or event in the same database. Stimulated reporting is the increase in reports triggered by a regulatory communication, a lawsuit or a media story. The US regulator's page names stimulated reporting and variable reporting of different exposures and outcomes among the limits of passive systems 1.
| Tier | Input | Answers | Characteristic failure |
|---|---|---|---|
| Spontaneous reports | Voluntary notifications of suspected reactions | Is there a pattern worth investigating? | No denominator; notoriety, masking, stimulated reporting |
| Observational cohort | Registers, claims or records with exposed and comparison groups | How much more often does the event occur, and in whom? | Confounding by indication; time-related bias; surveillance bias |
| Randomised trial | Participants allocated by chance and followed | Does the drug cause the event, where events are countable? | Too few events; short follow-up; selected participants |
Signal management as a regulatory process
In the European system the guideline sets out a sequence of activities: signal detection, signal validation, signal confirmation, signal analysis and prioritisation, and signal assessment with a recommendation for action 2. The text is Revision 1 of Module IX, adopted in October 2017 and effective from 22 November 2017. Prioritisation continues throughout and aims to find signals with potentially important effects on patients or on the balance of risk and benefit 2.
Validation asks practical questions before more work is committed: whether the reaction is already in the product information, whether the case data support an association, what the timing and plausible mechanism are, whether reporting is disproportionate where that can be assessed, and how serious and reversible the event is 2. The process is built to discard weak signals cheaply and to keep the rest moving.
Observational cohorts: active comparators and confounding by indication
A cohort study follows exposed and comparison people and counts events, so it gives what reports cannot: a rate, a rate ratio and a rate difference. The central threat is confounding by indication, in which the reason a drug is prescribed is itself linked to the outcome. Comparing treated patients with untreated patients mixes the effect of the drug with the effect of being the sort of patient who gets it. An active-comparator design reduces this by comparing two drugs used for the same indication in similar patients.
The new-user design adds a second safeguard. Including prevalent users, people already on treatment, introduces survivor bias, because those who had early problems have stopped and left the sample, and covariates measured at study entry may already reflect the drug 4. Restricting analysis to people starting a course of treatment removes both problems 4. Evidence tier: human observational.
Immortal time, new-user designs and target trial emulation
Immortal time is a stretch of follow-up during which, by the way exposure is defined, the outcome could not have occurred. If a study classes people as exposed only after they have filled a second prescription, the time before that second fill is guaranteed event-free, and the exposed group looks safer than it is. The error is easy to make, and it can distort estimates of harm as readily as estimates of benefit.
Target trial emulation is a framework for avoiding these errors. The analyst first writes down the randomised trial that would answer the question, covering eligibility, treatment strategies, time zero, follow-up and analysis, and then designs the observational study to match it 5. The framework gives a structured way to criticise a cohort study and helps avoid common methodological pitfalls, though it cannot supply confounders that were never measured 5.
Randomised trials: rare events, power and why safety is underpowered
Randomisation balances measured and unmeasured characteristics on average, which is why trials are the benchmark for causation. The limit is size. A trial is usually sized to detect a benefit on an efficacy endpoint, and a rare harm may produce only a handful of events. An illustrative calculation by the desk using the standard formula for time-to-event comparisons: to detect a doubling of rate with 80% power at a two-sided 5% level and equal allocation, about 65 events are needed. If the event occurs at 1.5 per 10,000 person-years in one arm and 3.0 in the other, that is close to 290,000 person-years in total, for example about 58,000 people followed for five years.
Most trials fall far short of that. The liraglutide cardiovascular trial randomised 9,340 people with type 2 diabetes and followed them for 3.5 to 5 years. It reported no difference in calcitonin between arms at 36 months and no C-cell hyperplasia or medullary thyroid carcinoma in the liraglutide group 7. That is a useful result and a limited one. With so few expected events, zero cases cannot exclude a modest increase. Evidence tier: randomised trial, underpowered for the rare outcome.
A worked example: one contested signal read through all three tiers
The thyroid C-cell question for GLP-1 receptor agonists shows the tiers in sequence. The starting point was preclinical: rodent tumours, covered in the pillar article for this cluster. In the reporting tier, the US prescribing information records that cases of medullary thyroid carcinoma in patients treated with liraglutide have been reported after marketing, and states that the data in these reports are insufficient to establish or exclude a causal relationship 8. That is what a report can and cannot do.
In the cohort tier, a Scandinavian active-comparator new-user study compared agonist users with users of dipeptidyl peptidase 4 inhibitors. Thyroid cancer occurred at 1.33 and 1.46 per 10,000 person-years, a hazard ratio of 0.93 (95% CI 0.66 to 1.31), with a medullary carcinoma ratio of 1.19 (0.37 to 3.86) 6. The authors noted that the upper bound of the main interval was consistent with no more than a 31% increase and that mean follow-up was 3.9 years 6. In the trial tier, the large randomised trial reported no C-cell malignancy in the treated group but was not sized to detect one 7.
Read together, the tiers agree on direction and disagree on certainty. No tier shows an excess; none can exclude a modest one, especially for a rare cancer with a long latency. The prescribing information accordingly describes the calcitonin and ultrasound monitoring as of uncertain value 8. Where the tiers had disagreed outright, the next question would be which has the better design for the specific bias in play.
What this means for a researcher reading the literature
Ask three questions of any safety claim. Which tier produced it? What is the denominator, and where does it come from? What would the result look like if the claim were false? A disproportionality score answers none of these; a well-designed cohort answers the second and part of the third; a trial answers all three for common events only. Report absolute figures alongside ratios, check the comparator, and treat agreement across independent designs as the strongest evidence available outside a trial.
References
- Data Mining at the Center for Biologics Evaluation and Research
- Guideline on good pharmacovigilance practices (GVP) Module IX - Signal management (Rev 1)
- Quantitative signal detection using spontaneous ADR reporting
- Evaluating medication effects outside of clinical trials: new-user designs
- Using Big Data to Emulate a Target Trial When a Randomized Trial Is Not Available
- Glucagon-like peptide 1 receptor agonist use and risk of thyroid cancer: Scandinavian cohort study
- No Evidence of Increase in Calcitonin Concentrations or Development of C-Cell Malignancy in Response to Liraglutide for Up to 5 Years in the LEADER Trial
- Ozempic (semaglutide) injection: prescribing information