receptor pharmacology fundamentals
Concentration–Response: EC50, Emax, and Why Potency and Efficacy Are Not the Same Number
Two compounds can be compared on where their curve sits and on how high it reaches. Those are independent properties, they answer different questions, and treating one as a proxy for the other is the most common misreading in this literature.
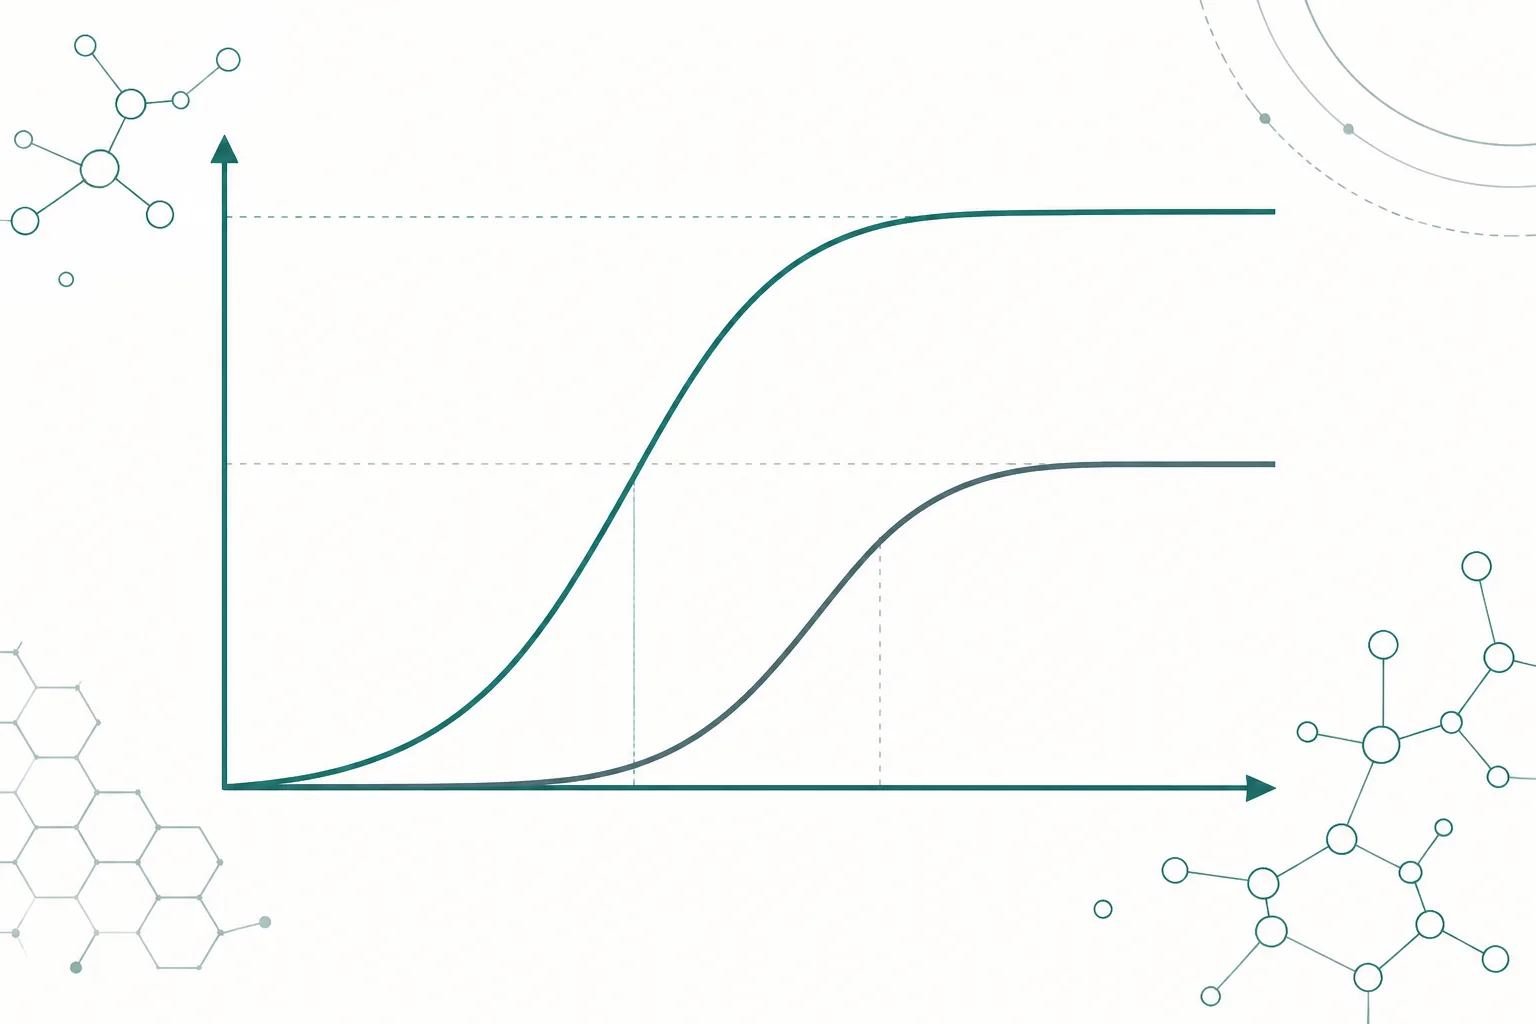
A concentration–response curve plots the size of a biological response against the concentration of the agent producing it. Two numbers are read off it, and they describe unrelated things. The EC50 is the concentration producing half the maximal response, and it locates the curve horizontally. The Emax is the largest response the agent can produce in that system, and it locates the curve vertically. Potency refers to the first, efficacy to the second, and a compound may be superior on either while being inferior on the other 1.
Keeping the two separate matters because the everyday senses of the words point the wrong way. In ordinary speech a more potent compound sounds like a better one. In pharmacology potency says only that less of the substance is needed to reach the midpoint of its own curve, and says nothing about how high that curve goes or whether the response it produces is the wanted one.
Why the axis is logarithmic
Biological responses to receptor occupancy typically span several orders of magnitude of concentration, from the threshold at which anything happens to the point where every receptor is occupied. Plotted on a linear axis, the informative region is compressed against the origin and unreadable. Plotted against the logarithm of concentration, the relationship becomes the familiar sigmoid, with a near-linear central section where the response changes most steeply.
One consequence is regularly misread. A curve shifted by one logarithmic unit is shifted tenfold; two units is a hundredfold. Small visual displacements therefore represent large multiples, and the reverse also holds — a difference that looks dramatic in a figure may be well within the variability of the assay. Reading these curves requires attention to the axis before the shape.
The steepness of the central section is described by the slope factor, often called the Hill slope. A slope near unity is what simple single-site binding predicts. A markedly steeper slope suggests cooperativity, multiple binding sites, or a threshold in the measured system; a shallower one suggests heterogeneity in the receptor population or the measurement. The slope is therefore diagnostic information about the mechanism and not merely a fitting parameter, which is why reporting it is expected 1.
Affinity, efficacy, and why occupancy is not response
The earliest receptor theory assumed response was proportional to the fraction of receptors occupied. That assumption failed on a simple observation: different agonists occupying the same fraction of the same receptors produced different responses. The resolution was to introduce a second property alongside binding — the capacity of an occupied receptor to generate a stimulus, which came to be called efficacy 2.
This separates two questions that the EC50 alone conflates. Affinity, expressed as an equilibrium dissociation constant, describes how readily the ligand binds and stays bound. Efficacy describes what happens once it has bound. A high-affinity ligand with no efficacy is an antagonist: it occupies the receptor and produces nothing. Structure–activity work that changes a molecule can alter either property, and interpreting such data requires knowing which one moved 4.
The framework that made this tractable quantitatively models the response as a hyperbolic function of occupancy, with a single efficacy parameter describing how effectively a given agonist–receptor complex is converted into response in a given tissue 3. Its practical value is that it explains how the same agonist can be a full agonist in one preparation and a partial one in another without any change in the molecule, purely because the two systems differ in receptor abundance and in downstream amplification.
Full agonists, partial agonists, and the ceiling
A full agonist produces the maximal response the system can give. A partial agonist produces less, and continues to produce less at every concentration, including saturating ones. This is the defining feature: the limitation is not that there is too little compound but that the compound's occupied receptors generate insufficient stimulus to drive the system to its ceiling 2.
Partial agonism has a second property that follows directly and is often surprising. In the presence of a full agonist, a partial agonist competes for the same receptors while delivering less stimulus per receptor occupied, so it reduces the overall response. A partial agonist therefore behaves as an agonist alone and as a functional antagonist against a stronger one, which makes the label context-dependent rather than absolute.
There is a further complication that makes the classification system-dependent rather than intrinsic. Where a tissue expresses receptors in excess of the number needed to produce a maximal response — a condition described as receptor reserve — a weak agonist may occupy enough of the surplus to reach the ceiling anyway, and will be recorded as a full agonist. Reduce the available receptor population, by partial irreversible blockade or by using a preparation expressing fewer receptors, and the same compound reveals itself as partial. Any statement that a compound is a partial agonist therefore carries an implicit clause about the preparation in which it was tested 3.
| Ligand type | Effect on Emax | What the EC50 tells you |
|---|---|---|
| Full agonist | Reaches the system maximum | Where its own curve is centred |
| Partial agonist | Plateaus below the system maximum | Where its own lower curve is centred |
| Competitive antagonist | None alone; shifts an agonist curve rightwards | Not applicable; potency is expressed as an inhibition constant |
| Inverse agonist | Reduces response below baseline where the receptor is constitutively active | Where its own suppression curve is centred |
Why the same compound has several EC50 values
An EC50 is a property of a measurement, not an intrinsic constant of a molecule. Three things move it without any change to the compound. Receptor abundance: a preparation expressing many receptors reaches its maximal response at a lower agonist concentration, because fewer occupied receptors are required. Amplification: a pathway with many downstream amplification steps produces a large response from a small stimulus. Readout choice: measuring an early second messenger and measuring a late cellular outcome give different numbers, because the intervening steps each contribute their own saturation 3.
The practical rule is that EC50 values are comparable within a study and unreliable between studies. A table assembled from separate publications, with different cell backgrounds, different readouts and different incubation times, does not rank compounds even when every individual figure is correct. Where a genuine ranking is needed, the comparison has to be run in one system against one reference agonist 5.
The same reasoning underlies how signalling bias is quantified. Because a raw pathway comparison would largely reflect differences in amplification between the two pathways, bias calculations combine affinity and efficacy into a transduction coefficient for each pathway and then reference the result to a standard agonist, so that system-dependent amplification cancels 5.
What a certificate of analysis cannot tell you
Analytical documentation answers chemical questions. Chromatographic purity describes the proportion of the material that elutes as the expected species. Mass spectrometry confirms that the molecular mass matches the intended sequence. Peptide content corrects for water, salts and counter-ions. All of this is necessary, and none of it is a measurement of receptor activity 1.
- Purity is a chemical proportion. A material can be chemically pure and pharmacologically inactive if the sequence folds or aggregates incorrectly.
- Identity by mass confirms composition, not conformation. Molecules of identical mass can differ in disulfide pairing or stereochemistry, and activity can depend on both.
- Neither figure reports affinity, efficacy or an EC50. Those require a receptor, a functional readout and a reference agonist.
- An activity figure quoted for a compound generally comes from the published literature on that compound, not from testing the batch in hand. The two are different claims.
The distinction is worth holding because the two kinds of number are frequently presented together as if they belonged to the same category. A stated purity is a property of a specific batch, verifiable by analysis. A stated potency is a property of a molecule, established in a system that the batch was never tested in 4.
Reading a concentration–response figure
- Check the axis. Confirm it is logarithmic and note how many orders of magnitude are covered.
- Check whether the curves plateau. A curve still rising at the highest concentration tested has no defined Emax, and any EC50 fitted to it is an extrapolation.
- Compare ceilings before midpoints. A difference in Emax is a difference in kind; a difference in EC50 is a difference in degree.
- Note the readout and the timepoint. Both change the numbers, and neither is usually stated in a secondary summary.
- Look for the reference agonist. Without one, the figures describe an assay rather than a molecule.
- Note the slope. A value far from unity is information about the mechanism and should be addressed rather than ignored.
Applied consistently, this reading disposes of a large share of comparative claims made about research peptides. The commonest defect is not a wrong number but an incomparable one: two figures drawn from different systems, presented as a ranking that neither study was designed to support 1.
Why the distinction is worth the effort
Potency is an economic and formulation property. It determines how much material is required to reach the active range, and therefore what is practical to make and to deliver. Efficacy is a biological property. It determines the largest effect obtainable at all, and no increase in concentration will move it. A compound can be the more potent of a pair and still be incapable of producing the response the other one produces 23.
For the peptide literature specifically, the useful habit is to ask which of the two a claim concerns before evaluating it. Descriptions of one compound as stronger than another almost always collapse the distinction, and the collapse hides the more interesting question: whether the two compounds differ in where their curves sit, in how high they reach, or — as the work on signalling bias shows — in which response was being measured in the first place 5.
References
- International Union of Pharmacology Committee on Receptor Nomenclature and Drug Classification. XXXVIII. Update on terms and symbols in quantitative pharmacology
- A modification of receptor theory
- Operational models of pharmacological agonism
- Binding, gating, affinity and efficacy: the interpretation of structure-activity relationships for agonists and of the effects of mutating receptors
- A simple method for quantifying functional selectivity and agonist bias